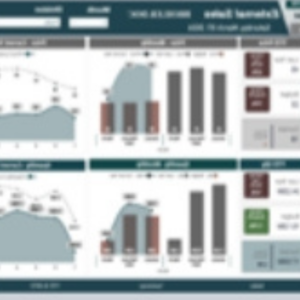
Commercial dashboards are powerful tools that help businesses track sales performance in real time and optimize their sales efforts. Key performance indicators (KPIs) , and customer lifetime value should be tracked to gain a better understanding of overall performance and identify areas for improvement. Sales analysis can also be conducted to gain insights into sales by product, region, or customer segment, which can inform data-driven decisions about sales strategy and drive revenue growth.
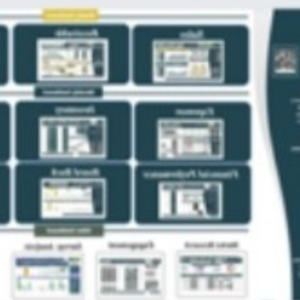
Interactive financial dashboards provide real-time and comprehensive overviews of a business’s financial data, including cash management, expenses, sales, and profits, in an easily digestible format. They allow for drill-down analysis, enabling data-driven decisions to keep businesses on track with their financial goals. Interactive dashboards promote productivity and efficiency by consolidating financial data to generate immediate, actionable insights. A professional financial dashboard includes components such as Cash Management, Financial KPI, Profit and Loss, Actual vs Forecast, and Financial Performance.
Procurement and Supply Chain KPIs are essential in managing the department to ensure sustainable and improved processes. From regulating costs and purchases to delivering savings, these metrics play a crucial role in procurement management. To track, evaluate, and optimize procurement processes, purchasing managers use procurement dashboards. The procurement department is a strategic function that bridges the gap between a firm’s needs and suppliers or contractors, making it a critical aspect of an organization’s competitiveness. A professional procurement dashboard includes various components such as the Procurement KPI Dashboard, Supplier Delivery Dashboard, Cost Dashboard, and KPI Scorecard, all of which can optimize processes and deliver value throughout the organization.